Widgets
A widget is one chart on a reporting dashboard. You pick a data type, a chart shape and optional filters.
What widgets are for
Each widget answers one question, such as how many tasks are open per status or how many hours were logged. You add as many as you need on a dashboard. See Reporting overview.
Where to find it
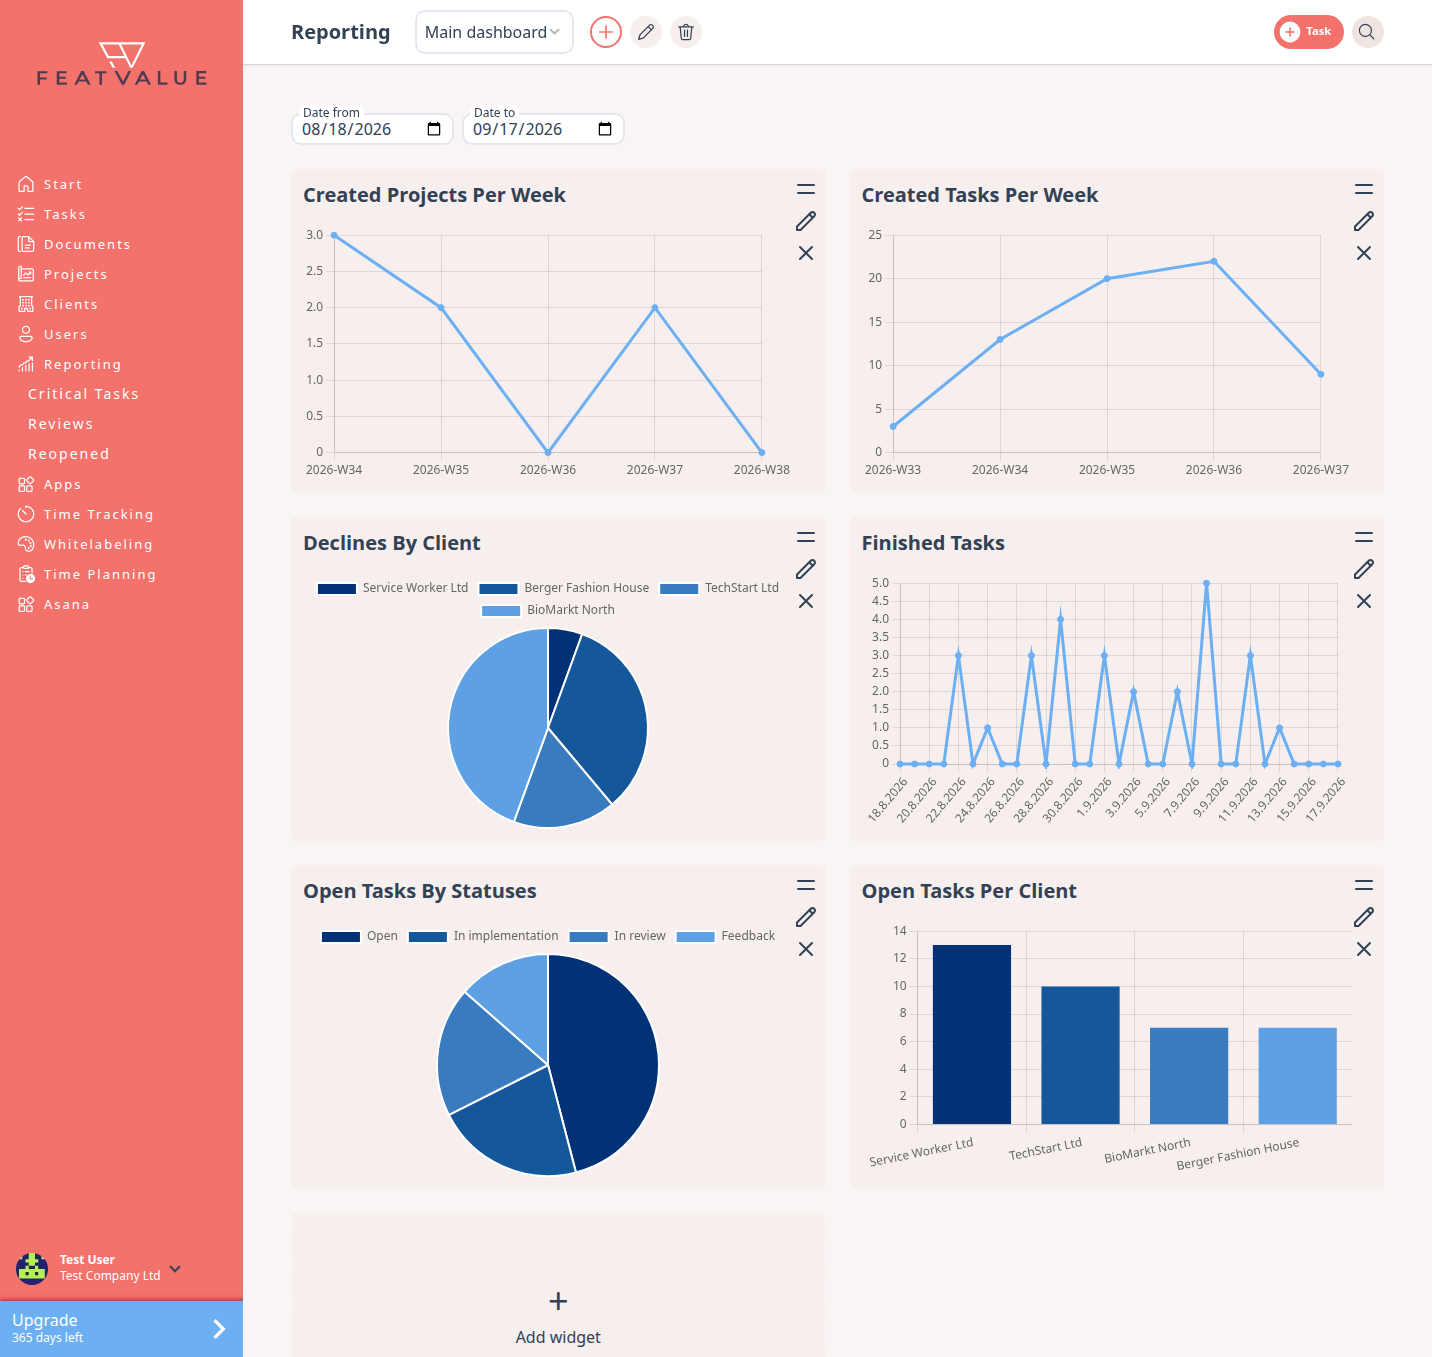
Open Reporting and a dashboard. The empty tile is Add widget. Existing widgets have Edit widget when you edit the dashboard.
How it works
-
Choose a data type
Click Add widget. First pick a category: Usage, Budget, Capacity or Quality. Then Step 1: Select data type lists the widgets in that category. -
Choose the chart
Step 2: Select representation offers the shapes that widget supports: Pie chart, Line chart or Bar chart. -
Configure details
Step 3: Configure details sets the Name and Filters. Filter operators are is, is in, is not and is not in. Typical fields are Client and Project. Click Create.
Overview of widgets
- Budget Cuts By Client
- Created Projects Per Week
- Created Tasks Per Week
- Declines By Client
- Finished Tasks
- Open Tasks By Statuses
- Open Tasks Per Client
- Reviews By Categories
- Reviews By Statuses (in %)
- Sprint Movements - Tasks (unfiltered)
- Sprint Movements - Story Points (unfiltered)
- Story Points Per Sprint (open tasks)
- Task Status Transition Time (days)
- Hours Spent Per Day
- Billable Hours
- Schedule Adherence
- Sprint Progress in %
- Budget Utilization
A new Default dashboard already contains the standard set: created projects and tasks per week, open tasks by status and per client, finished tasks and declines by client. Time widgets need time entries; see Time tracking. Sprint widgets follow Sprints.
Permissions and plans
Widgets live on Reporting, which needs Pro or Enterprise. See Reporting overview.
Your question has not been answered?
We will be happy to help you. You can send us an e-mail or arrange a video conference: